How to spot easy trades using Elliott Wave analysis in any market.

Few are meant to ride the big wave, let alone the crests found at the Mavericks in Half Moon Bay. They can top out over 60 feet and are recorded on the Richter Scale, not your smartphone.
Assuming you’re ready to ride, knowing when and where is half the battle in taking advantage of the (in)famous winter season. The surf report is one of the most widely anticipated releases for experienced wave chargers.
More than one surfer has traded their moment of glory for panic by not knowing the conditions or when a wave will likely hit.
In the violent bay of the market you can not only avoid getting crushed by waves — you can profit from them.
In fact, the Elliott Wave Patterns can help you quickly plot future waves’ price. Consider your personal price action forecast your surf report when trying to catch the waves of profitable, high probability entries.
There are several intricacies to Elliott Wave analysis trading, but simply mastering the basics can mean the difference between consistent profits or drowning losses.
For this eBook, we’ll leave the PhD in wave analytics to someone else and talk about easy-to-spot conditions you can use to grow your account.
Let’s start with the basics.
Chapter 1:
Elliott Wave Analysis: Your Futures Day Trading Price Action Forecast
Interestingly enough, Elliott wave analysis was developed by pure fate. The inventor, Ralph Nelson Elliott, was forced into early retirement due to a debilitating intestinal illness.
To occupy his time, he studied 75 years’ worth of yearly, monthly, and daily market charts. He even made his own 30-minute charts across different indexes. His objective wasn’t to predict exact price movement, but rather to provide a path for judging overall market direction with a high degree of accuracy.
He didn’t apply this theory just to the market — but rather to all collective human behaviors. In short, he believed that just about everything could be boiled down to a series of patterns — that were easy to read, and easy to predict.
At its core, the Elliott Wave principle consists of two types of waves — both of which can be used for futures day traders at all levels:
- Impulse Waves: These waves generally follow the same direction or trend and consist of five parts.
- Corrective Waves: Once the impulse wave has run its course, a three-part corrective wave sets in, moving in the opposite direction.
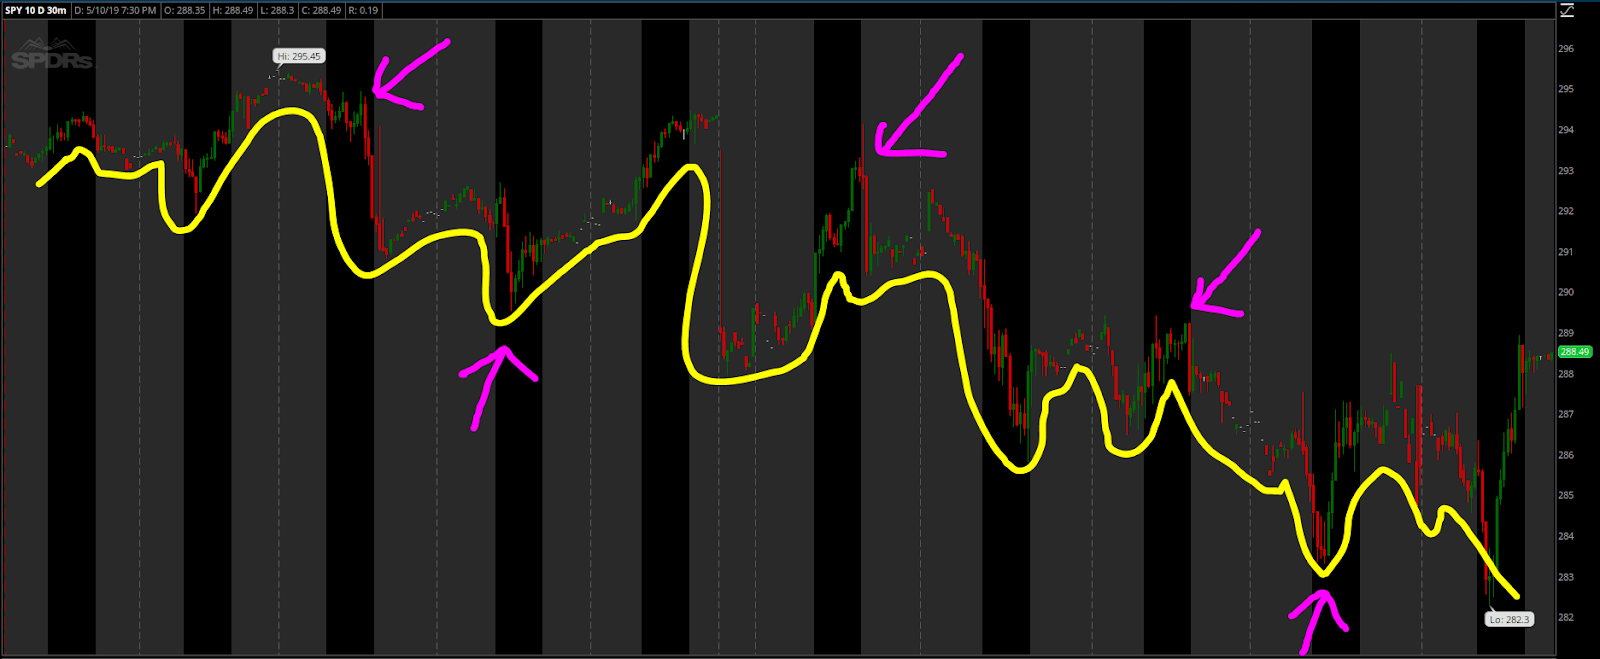
These waves can be pieced together to create larger patterns.
You can dial in patterns that appear in larger timeframes into smaller 60-, 30-, and even 5-minute patterns.
For example: Using the above SPY 30-minute chart, you can casually see the trend and pullbacks at a glance. The science of Impulse and Corrective waves predicts this price action simply by monitoring the patterns and direction.
Why should you care about any of this?
Because if you can spot a wave, then you can determine overall market direction and the underlying patterns… and you can also start to stalk a high probability reversal or continuation entry.
Let’s be clear, you don’t need to complete a 5-year analysis to get the Elliott Wave snapshot you need to trade on an intra-day, short-term chart.
Even better: You can do this in any market you like, using any timeframe. Literally every market you look at is in some cycle or leg of one Elliott Wave or another.
Now, there are literally thousands of resources you can study when it comes to Elliott Wave analysis. All you really need however, is to understand the basics.
Note to the reader: If you’re looking to spend the next 4 years studying Elliott Wave analysis with the goal of getting your PhD, this might not be the eBook for you. However, if you are interested in turning a consistent profit in the near future so that you can make trading a full-time source of income AS A FUTURES DAY TRADER… keep reading.
Let’s start with the structure of the Impulse and Corrective waves.
Chapter 2:
The Impulse: An Impossible-To-Miss Intra-Day Price Move
Picture any ocean front you’ve ever seen or been to. The tide goes out, and then it gets reeled back in. Every day. Like clockwork. Sure, when you step back and take a look at the larger picture — the moon, sun and gravity all play a role. But the pattern is very clear, and the result is unmistakable.
The same is true with day trading futures price action waves. The ‘tide’ goes out… and then it gets reeled back in.
Put another way: There’s a move in one direction… and then there’s a correction 15, 30 or 60 minutes later.
Just like a literal ocean tide, there are a zillion factors that can influence price action waves on any given stock, index, futures contract, or forex pair. You name it… jobs reports, interest rates, consumer confidence, oil inventories… there are a zillion price action influences.
All of these price action events are big futures day trading money-making opportunities.
But for the purposes of turning a profit as a futures day trader working with shorter timeframes? Let’s keep it simple.
- The market makes a move in a particular direction… a trend… based on any number of events. That’s an Impulse Wave.
- After the impulse wave subsides… the market corrects… and pulls back, just like the tide. That’s a Corrective Wave.
It’s that simple. The key is being able to spot the current wave that the market is in at that moment by analyzing the preceding waves. You don’t have to pull all the way out to a five-year view of that market. You can simply back away from your preferred day trading timeframe to a 15-, 30- or 60-minute chart. This will put you in a position to anticipate the coming wave and plot your trade.
Impulse Waves can be spotted quickly because the market is moving in a particular direction. Uptrends have higher and higher highs after each interim pullback. Downtrends have lower and lower lows after each interim pullback.
Simply put: You want to initially trade in the direction of Impulse Waves because price is moving in that direction.
Why does that matter?
If you’re trading in a major index, currency pair — or a stock with decent intra-day volume — trading with the trend means that you’re trading alongside (or with) the institutional traders.
These are the folks that drive 95% of the market’s volume. So profit with them.
Following the Elliott Wave analysis principle, Impulse Waves have 5 legs or components. You can spot them pretty easily because legs 1, 3 and 5 are moving with the trend, while 2 and 4 present intra-trend pullbacks.
Here’s a perfect example: Check out the below SPY chart on a 30-minute timeframe. The big moves downward are impossible to miss looking at the yellow 1, 3 and 5 waves. What’s in between? The blue intrawave connections marked by 2 and 4.
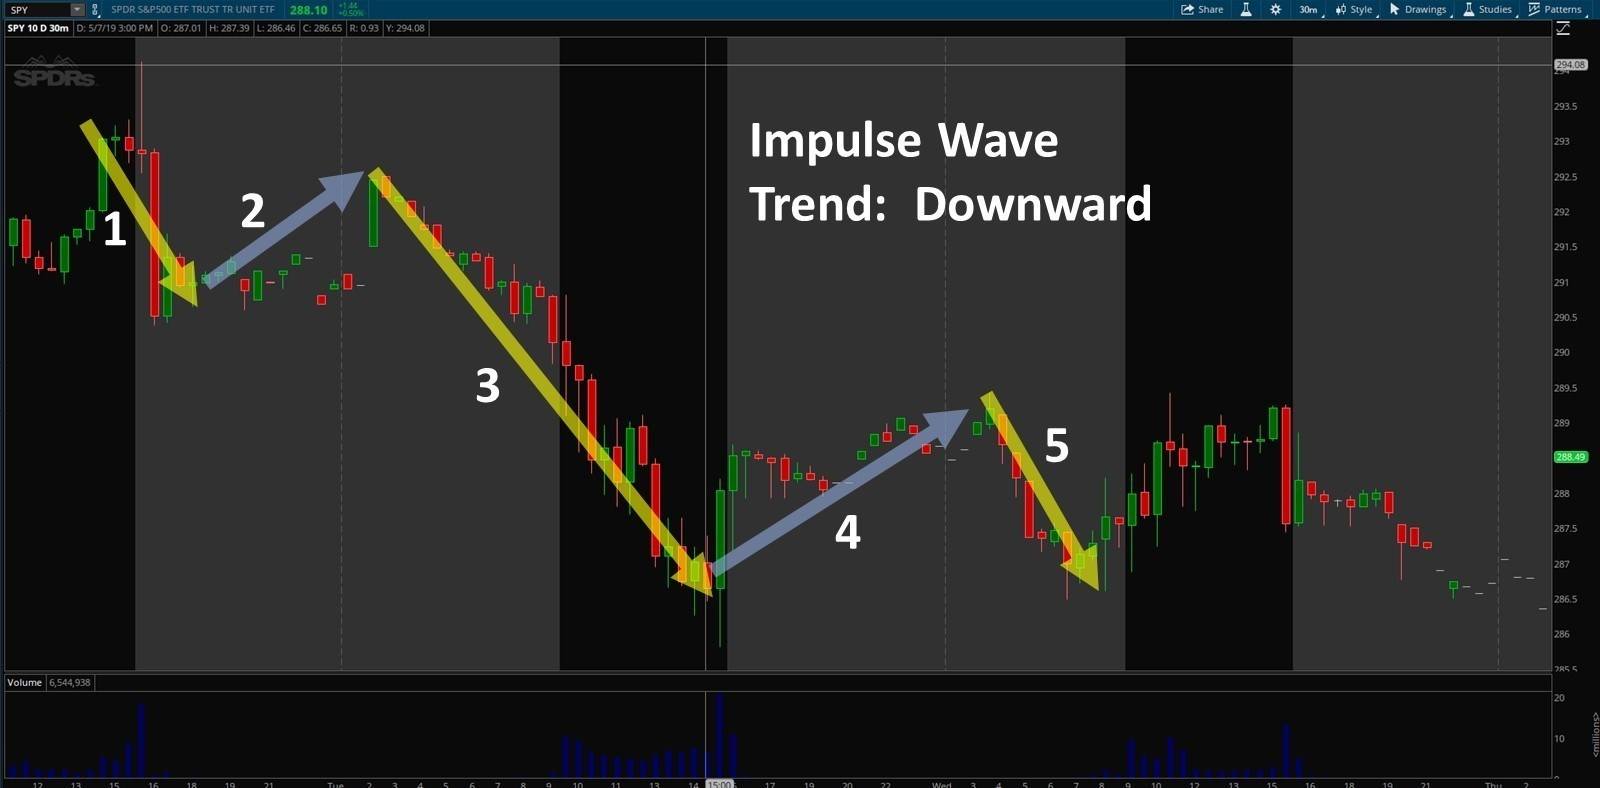
This structure is important because Nelson Elliott identified the following common elements in a trend when analyzing 75 years’ worth of market data:
- Uptrends typically have three large price moves (waves 1, 3 and 5)
- >> Each of the three price moves create LOWER lows.
- There are almost always two interim rest periods that serve as connections (waves 2 and 4).
- >> None of the corrections take out the prior highs or lows of the previous impulse move. For this reason, they are more neutral.
The result is a five-wave pattern that you can spot very quickly: Impulse, Connection, Impulse, Connection, Impulse.
Think of the Impulse Waves as coming in different stages with the third Impulse Wave usually being the biggest move.
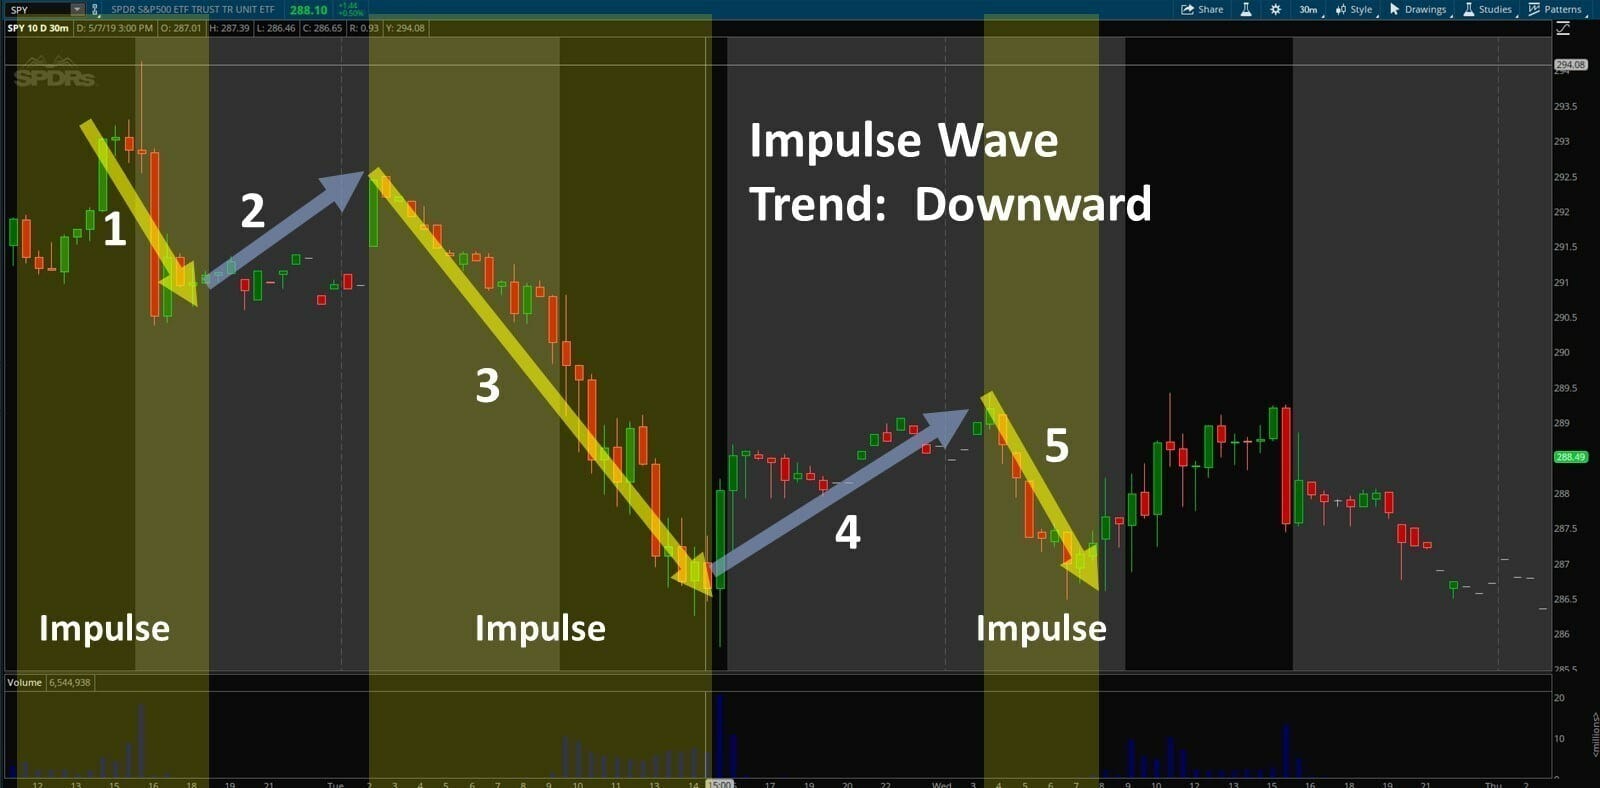
The connections within the Impulse Wave? They’re almost always minor retracements or sideways price action.
If you’re looking to trade either with the trend, or on the reversal — you want to be aware of these connections, but you don’t want to enter on them. The reason why? You should have more time, and more confirmation from the price action to make a high probability entry.
Welcome to the second Elliott Wave structure: The Corrective Wave.
Chapter 3:
Confirming The Correction: Your Opportunity For Profit
It was Warren Buffett who famously said: “Only when the tide goes out do you discover who’s been swimming naked”.
This is especially true when the party is over for an Impulse Wave during any intra-day timeframe as a futures day trader.
The market has made its run, and now we’re due for a correction — or in Elliott Wave analysis world, a Corrective Wave.
This is when the market hits the pause button on the Impulse Trend’s movement and reverses. The correction can be spotted because it comes with three distinct price moves of its own. Since the Impulse Wave is usually labeled with the numerals 1-5, the Corrective Wave comes with the letters A-C.
Here’s another example, this time using the EUR/USD and an upward trend.

A fast and easy way to spot a Corrective Wave? The prior lows on a downtrend become higher, and the highs established on leg 4 of the prior impulse are overtaken with a new high or low.
Notice that after the uptrend Impulse Wave runs its course with five stages, the Corrective Wave sets in.
There are three, easy-to-spot legs to the corrective wave:
- The Move: A sharp correction downward signals the beginning with leg ‘A’. The following two legs will tell us if this is really a Corrective Wave.
- Failed High: The second leg within the wave fails to take out the high established with the final leg of the prior Impulse Wave. Buyers have fought to keep price moving up, but you turn the fate of the Elliott Wave around.
- New Low: The third leg takes out the prior low established with the 4th connection wave in the prior Impulse Wave.
It’s this third leg of the Corrective Wave that tells us if we’re simply taking a pause in the trend — or if price is going to reverse.
The criteria for this analysis is very straightforward:
- If the prior high in the Impulse Trend is not overtaken, and a new low established — look for a reversal and a downward trend to ensue.
- If the prior high is not overtaken, but the prior low remains intact — start stalking a trade with trend established with the prior Impulse Wave.

The above formation is known as an ‘ABC’ correction. There are actually 21 variations of the corrective formation. (Relax… The 21 variations can be broken down into three easy-to-spot formations.) 🙂
Here’s a chart you can use as your cheat sheet:
| Correction Type | Description | Formation |
|---|---|---|
| Zig-Zag | The correction is very sharp against the prior Impulse Trend.Wave B is usually the shortest compared to ‘A’ and ‘C’.Within ONE overall correction, you can spot multiple Zig-Zags linked together. |  |
| Flat | Instead of making a sharp move to the reverse of the Impulse Wave, price simply decides to grind along.Each of the A, B, C elements of the wave are pretty much equal.Be prepared to ride out a grinding wave until a clear direction is identified. |  |
| Triangle | When Impulsive Trend lines start to converge or diverge a triangle correction will form.Look for expanding or contracting correction waves moving in the opposite direction of the prior Impulse Trend. |  |
Keep in mind that the above examples demonstrate a correction coming out of an uptrend. For a downtrend, simply reverse the formations.
Chapter 4:
Elliott Setups: Two Impossible-To-Miss Intra-Day Trades
Depending on your preferred style and the type of wave you want to ride, there are all kinds of surfboards you can choose from. The two most common choices: Longboard or Shortboard.
The same is true for Elliott Wave trade setups. In a sea of possible trade setups, let’s boil it down to two, impossible-to-miss trades that any trader — at any level — can make.
Setup #1: Profit from the Impulse Action
Within the five legs of the Impulse Wave, there are two easy entry points. Both of them sit right at the conclusion of legs 2 and 3 when price is resting or connecting to the next impulse move.
This presents an excellent opportunity for an entry with the trend as a continuation. In both cases, your exit is either the end of the impulse at the conclusion of the 5th leg, or at the 4th leg on the next retracement.
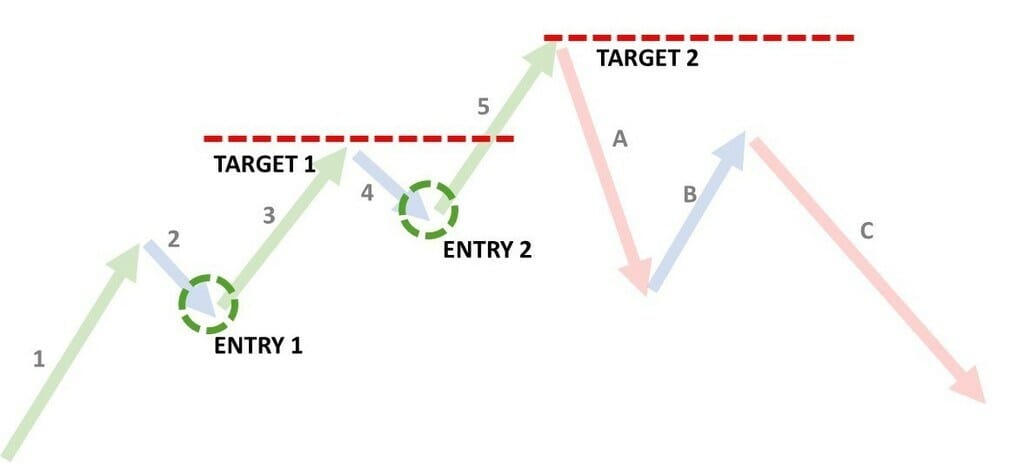
Setup #2: Reverse with the Confirmed Correction
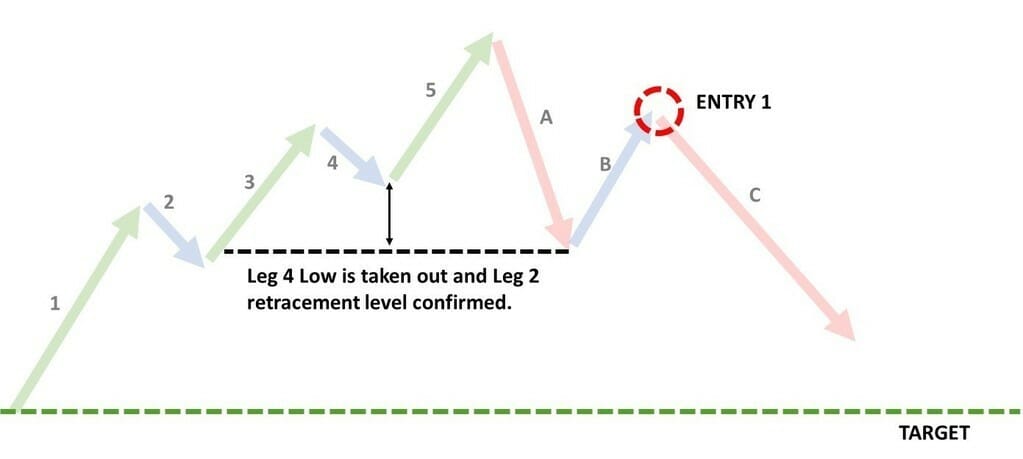
Once the ABC Corrective Wave is in motion and confirmed, you’re simply looking for leg 4 of the impulse to be taken out. Once that happens, monitor the price level for the bounce on ‘B’. If it coincides with the prior support shown on leg 2 of the impulse (or prior support), enter at the close of the ‘B’ leg.
Your target at entry is the initiation point of the prior Impulse Wave — which could be ridden for quite some time depending on the size of the impulse.
Both of these setups work in any market and in any timeframe. They can be further confirmed with the oscillator of your choice to monitor overbought and oversold price conditions — two further elements of a reversal.
The key? Simplicity and patience. Be willing to let the waves unfold. Recognize that a wave is comprised of multiple candles and each wave might be different.
When in doubt? Revert to the four infallible rules of the wave.
Chapter 5:
Rules Of The Wave: What To Surf And What To Avoid
Believe it or not, there is actually a written code of conduct for surfers. It’s only five points, but it covers everything you need to know if you’re about to ride a wave when other surfers are around.
There are rules to keep in mind with Elliott Wave surfing as well. These are basics that will help as you become comfortable spotting Impulses and Corrections — ultimately entering with or against the trend.
Rule 1: Trade WITH the impulses to start. Remember, the volume driving the buy or sell action is driven by a force much larger than you and your account.
As mentioned earlier, these are the institutional forces that drive 95% of the market’s volume. Until you become practiced with analyzing correction conditions with a high degree of certainty — err to the side of trading with the impulses.
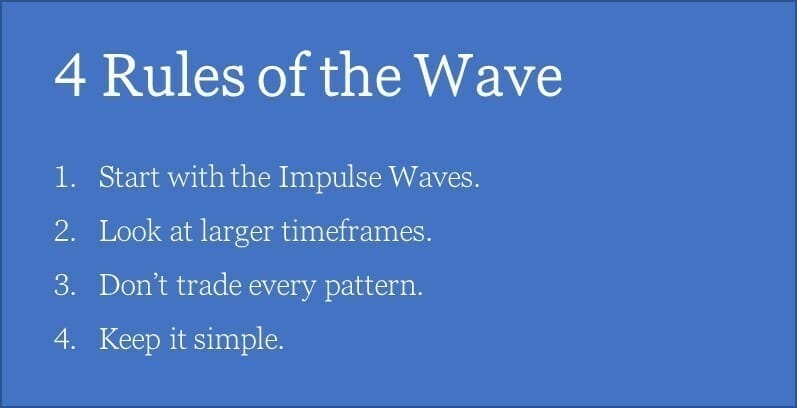
Rule 2: When in doubt, pull back. If you’re not sure what direction the wave is going, or what phase it might be in (Impulse vs. Corrective), simply pull back to a larger time period.
The science of Elliott Wave patterns follows the same principles of fractal analysis. That means (in part) that chart patterns are often embedded within larger chart patterns that have a habit of repeating themselves. If you’re looking at a 5-minute chart and don’t know — pull back to a 30- or 60-minute chart.
This will allow you to see a collection of waves for context. Once you have that established, zoom back in.
Rule 3: Repeating patterns doesn’t mean repeating trades. Just because the market displays the pattern of ‘Impulse’ followed by ‘Correction’ doesn’t mean that you should be trading every Impulse or Correction that you spot.
For instance, if the impulses are getting less and less pronounced, it’s a good idea to back away and wait for a bigger move. Or if there is an impulse in the opposite direction sit back and wait for it to unfold.
Rule 4: Keep it simple. Many traders are on the lookout for so many different formations that their chart becomes a jumbled meaningless mess.
Price action moves in a structured manner (impulse, correction, impulse, correction) regardless of timeframe. Stick with the timeframe and strategy that you feel the most comfortable with. Apply the same risk and reward measures that you historically have applied.
Add Elliott Wave analysis as a means to supplement your trade confirmation process and surface new opportunities. After spotting and trading your first Impulse Wave, you’ll be surfing for additional profits in no time.
Chapter 6:
Riding Elliott Waves For Day Trading Profits
So if you’re a day trader reading this and thinking… “I don’t have weeks and months to wait for an Elliott Wave to unfold, I need to generate profit during my session so that I can retire in this lifetime!” Well, you’re not alone.
Here’s the dirty little secret most Elliott Wave analysis educators don’t want you to know: There’s actually a day trading shortcut.
You read that right. There’s actually a shortcut for day traders. It sounds crazy, but it’s true. You don’t have to obsess over counting every single Impulse Wave, Corrective Wave, or Zig-Zag pattern.
You can simply watch for the Money-Making Waves.
Here’s a preview: It’s the 3, 5, A, and C waves.
Why? Well here’s the deal: Those are the waves that have been proven since 1938 to be tied to the direction of the big bull and/or bear trends.
This means that you are zeroing in on the direction of least resistance.
So, you don’t have to be a market pro, become a CMT (Certified Market Technician) or get your PhD in market dynamics to quickly analyze, count and track the most important parts of Elliott Waves.
In fact, the secret actually gets a little dirtier if you can believe it. There are indicators that do the work for you. It removes all of the guesswork that comes with trying to identify which market waves and directions you should be trading.
If you’d actually like to make money with Elliott Wave trading you need to:
- Avoid manually watching waves by hand, no matter what educators tell you. It’s unreliable and very difficult to achieve consistent results.
- Streamline your trading process so that you’re setting aside the parts of the Elliott Wave patterns that won’t make you money.
- Set aside the theory and actually execute high probability trades that don’t keep you glued to your screen for hours and days.
Save yourself the heartburn of having to pour over dozens of charts. Save your account from the heartache of costly trial and error while you work to master Impulse and Corrective waves.
Simply have them added to your chart and naturally find more winners every day!
