It couldn’t have come at a worse time. Cold War tensions were at an all-time high. The nuclear arms build-up was moving at warp speed and it seemed the world was waiting for something horrible to happen.
Not the time for a misunderstanding.
Then Nikita Khrushchev stepped to the mic at a reception at the Polish Embassy in Moscow. It was November 18th, 1956 and he was addressing ambassadors from the West. ‘My vas pokhoronim’ was the statement that caught everyone’s attention.
The immediate mistranslation that was passed along by American reporters? ‘We will bury you’. Not exactly the best time for a mistranslation.
It’s known now that it was a misunderstanding. If anyone would have looked further, they would have found that Khrushchev was using a common Russian phrase. Nonetheless, the comment horrified the West.
Every day, in every market, there are moments like these. It’s called divergence – when market price and data are heading in opposite directions sending mixed signals that can be mistranslated by everyone.
If you know what to look for, you can use these as your moments for profit.
When a trend is nothing more than a joke
Accurately translated, the statement would have come across as ‘I feel bad about your ignorance, but it’s your funeral not mine.’ A little more benign – but the misunderstanding took Cold War tensions to a new high.
This seemingly terrifying statement turned out to be nothing more than a sarcastic joke – which was missed by most.
When market price and data indicators are conflicting, it can send traders running for cover. In reality, this is a condition that you want to keep an eye out for.
For instance, if the market continues to climb, but the MACD isn’t strong – that could be a sign of weakness. Further, it could be an indication that the trend will change in the future and that a correction is on the horizon.
If you’re working with Stochastics, MACD, RSI or MFI – you could have a great starting point for spotting divergence in the making.
Spotting divergence in seconds, in any market
Never one to back down from a fight, it was John F. Kennedy who warned he would press the big red button himself if the Soviets didn’t back down. This came to a head during the Cuban missile crisis – otherwise known as the 13-day standoff.
Perhaps he was able to see or read something that other, more hawkish leaders didn’t. These were the folks who were simply following the trend to that point – while Kennedy seemed to sense the ‘divergence’.

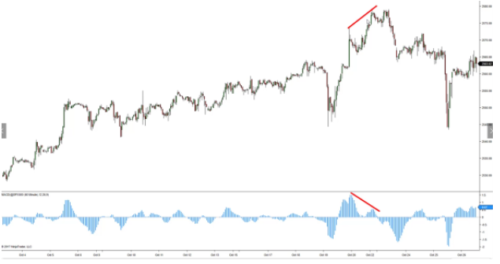
You don’t need to sense divergence, nor do you need an international crisis to spot it on your chart. Here is a perfect example – the MACD on the S&P 500 – using a 60-minute chart.
What we’re looking for is a conflict between the MACD and the current market price. Notice how price is moving in an aggressive uptrend while the MACD is in a downtrend:
What’s on the horizon? You guessed it. A market correction.
Trading with corrections when market truth surfaces
It took the West a full six years from when Khrushchev made his statement to understand that the Soviets weren’t pursuing nuclear war. It wasn’t until much later that an understanding was reached on arms and de-escalation.
You don’t need to wait for decades for opportunity to unfold on your chart when watching for divergence. Simply stalk the moments when price and your indicator are heading in opposite directions.
These are signs that the price movement or trend is showing weakness and that a reversal is likely on the horizon.
Make sure you have an eye on volume – and get ready to enter when you see confirmation that a correction is in the making. Don’t ignore the fundamentals of your index or oscillator – knowing that they’re there for a reason.
Above all don’t get caught up in the mass interpretation that leads traders to be caught on the wrong side of a trend. Wait patiently for divergence to surface and then profit when the market truth comes out.
