Murder Wall. Otherwise known as the north face of The Eiger. One of the world’s most deadly ascents for even the most experienced of mountain climbers.
Over 13,000 feet, at least 64 climbers have died attempting to summit this mountain in the Bernese Alps. Unforgiving conditions aside, failed anchors were among the contributing factors in some of those horrific falls.
For a mountain climber, an effective anchor, or fall restraint device, is the difference between life and death. As a trader, failure to have proper anchor points for your trades can send your profits into a fatal freefall.
While every climber knows an anchor is important, advanced climbers use more than one type as they make their ascent.
For traders, support and resistance levels are also regarded as important anchors. However, the approach is often left to one overly simplistic method, signaling trouble for your trades.
Combining moving averages with consolidation zones is the first step in reaching the summit of consistent profits while safeguarding your account.
Support and Resistance anchors are already in your pack, waiting to help
As you’d expect, climbers have a variety of anchors to choose from. Sure, tying your rope around a tree is an option, but most select from a set of sophisticated artificial wedges and belays.
Consolidation zones and moving averages are among the commonly-used tools when anchoring a trade on the edges of support and resistance. Like their climbing counterparts, they’re designed to serve as points of reference and safety.
Each has a specific use and easy application:
- Consolidation Zones: Areas where high volume has compressed price into a discernible area with a definable cap and bottom. These represent the basic value area being dictated by the institutions.
- Simple Moving Average (SMA): The average closing price over any given time period. Commonly set up with three reference bands set at 20, 50 and 200 minutes respectively will indicate trends in price.
- Relative Strength Index (RSI): An oscillator that measures the speed and change of price movements between zero and 100. An RSI over 70 indicates a market that is overbought, and oversold under 30.
Used individually these methods can provide important reference points on price – at a particular point in time. Together, they can bring additional safety in sizing up high-probability trades.
Using more than one anchor to avert disaster
An anchor isn’t designed to be used for every circumstance or situation. Experienced climbers will use a variety of anchors to provide multiple safeguards. As potential danger presents itself in different forms, they are covered.
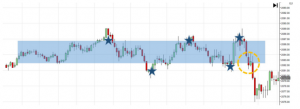
Note the consolidation zone to the right… viewed individually it appears that price is behaving as it should within the value area. You’ve been clipping along buying and shorting, completely unaware of the trap that awaits.

Trades at the edges of the consolidation zone work… until they don’t.

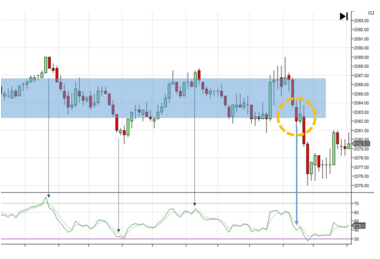
RSI tells you something that the consolidation zone didn’t! You haven’t yet reached oversold conditions.
Had you grabbed that last dip, betting on the reversal without checking RSI or SMA, things would have gotten pretty nasty quickly. Depending on where your stop was, you could have immediately erased the prior profits you worked hard to rack up.
Spotting these hazards can be made infinitely easier with an indicator that dynamically displays support and resistance levels.
Upgrade and monitor any potential profit mountain you like
There are several factors that influence a climb at any time. Developing conditions like falling rock and avalanches can come out of nowhere.
Layer on RSI — set at 70/30, you’ll see that the trades you’ve taken have mostly been right as price has approached or exceeded extreme buying conditions. Not so with the last dip below the zone.
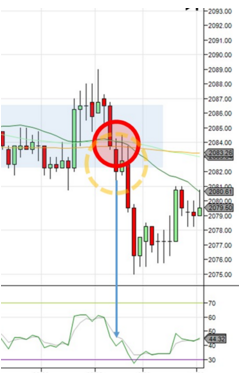
The addition of a 20, 50, 200-minute SMA and you’ll see that the average are converging. In fact, the 20 SMA in green is about to cross both the 50 and 200, and indication that something is amiss.

The RSI’s fears are confirmed, the 20 SMA is in the process of crossing the 50 and 200.
Imagine being able to dynamically track these factors across multiple instruments, receiving real-time notifications when particular zones have been breached. It would be like having a sherpa guiding you via radio — not just on your current mountain, but the entire range.
Real time support and resistance levels — for your mountain, and every other mountain on the range!
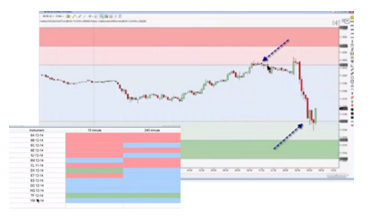
The Dynamic Support and Resistance Zones Indicator from Ninjacators tracks movement in relation to buying and selling zones in real time. Five zones plotted, giving you a sense of support and resistance strength — real time. It does this not only directly on your chart, but also with a Market Analyzer that simultaneously monitors a multitude of instruments.

Real time support and resistance levels — for your mountain, and every other mountain on the range!
This way you can spot entry opportunities as they surface. Then, using the discipline of comparing against your other anchors, you can validate and make your move.
Why spend your time leaning on the same anchors everyone else is using when you can have real-time confirmation for your entries and exits?
Respecting the mountain and the process
Discipline and a regimented process that respects the rules of the mountain are what saves lives in the end. This is why twice as many climbers turn back for basecamp in favor of better climbing conditions to come.
When your price is flirting with the edge of support and resistance and your indicators aren’t giving you a clear signal — do nothing. Return to the basecamp of waiting for true pricing extremes — that are confirmed — before entering your trade.
Nothing dulls your senses and suspicion of a possible break-out than a run of success. Like our prior example, trades made in the zone were profitable — until they suddenly weren’t.
If your anchor fails you, it’s because you’ve applied too much weight on its signal alone. If multiple anchors are conflicting and you don’t have a sense of volume — it’s best to sit tight.
A losing trade often is a failure of discipline and process — not the indicator or the signal.
Multiple anchor points and sustained profits
In 1953 Pete ‘the Belay’ Schoening stopped the fall of six men, acting as a human anchor, wedging himself against a frozen boulder with an ice axe. Skill, strength and quickness saved his companions.
Accurately assessing support and resistance, especially in times of fluctuation, takes practice and more than one tool.
Use consolidation zones as a means to understand the general landscape of price that you’re dealing with. Plot the 50, 100 and 200 minute SMA as a means to verify tests in support or resistance. Verify that you’re headed for an extreme with dips below 30 and spikes above 70 on the RSI.
Anchor your trades with this discipline, and then further augment them with the Dynamic Support and Resistance Indicator from Ninjacators. This will give you further confirmation, along with perspective on what’s taking place across the entire mountain range of instruments.
With S/R anchors you’ll save yourself from fatal fluctuations — and reach the summit of daily profits.
