January 15th, 2009. U.S. Airways Flight 1549 was leaving Laguardia when it struck a flock of Canada geese – three minutes into the flight. What happened next would be seared into the consciousness of the American public as one of the most heroic landings ever.
The options were limited: Turn around, or park it in the Hudson – skidding in Starsky and Hutch style with one hand on the wheel. It was the latter that was chosen in a second, and pulled off with everyone surviving. No doubt it was a combination of tools and experience that made for the safe landing.
While in flight with an entry that’s hit a flock of geese, you can use Stochastics to stabilize your trade and make a safe landing. Setting it up is simple, and managing your trades with this tool is very straightforward.
Why most trades crash right after liftoff
It was a routine commuter flight, headed for Charlotte. Take-off was cleared from LaGuardia’s runway for 3:24 in the afternoon. With First Pilot Skiles in control, the crew made their first check-in at 3:25 after getting about 700 feet in the air. Two minutes later, passengers would later report hearing loud bangs, followed by flames coming out of the engines and the cabin filling with the odor of fuel. The flock of Canada geese had made their presence known and both engines were immediately useless.
When volume in the market is peaking, millions of traders find themselves in a ‘mayday’ situation – mere seconds after they’ve made their entry. In many instances, they’re evaluating basic candle formations – really with no clue as to the momentum that’s driving the market in one direction or the other.
It’s like trading without any idea if their entries have any thrust or not. As a result, their trades either head for cruising altitude like they’re supposed to – or they lose power and start heading for the ground like flight 1549.
Fortunately, there is a tool that can be used to monitor market ‘thrust’ with a simple glance.
A real-time tool that tells you if the market has thrust
Within seconds captain Sullenberger and his co-pilot Jeffrey Skiles were able to see that both engines were rolling back – meaning they were both losing thrust. A simple glance at their instrumentation told them what they already could feel – they were falling out of the sky.

Unfortunately for many traders, they have no idea where price really sits relative to momentum and/or direction. They simply see candles pushing in one direction or another. Stochastics is a tool that can be quickly added to your chart to avoid this – providing an easy way to analyze the view of a market’s momentum.
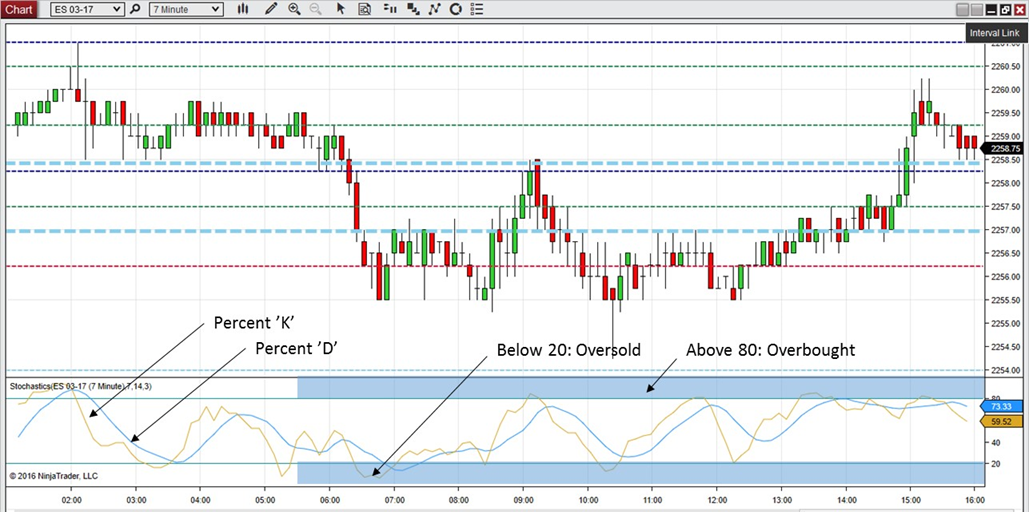
Found on just about any trading platform, this oscillator presents the location of a closing price of a market instrument in relation to the high and low range of the price over a period of time – usually a 14-day period. This relationship is presented in two bands – the ‘percent K’ and the ‘percent D’ – which is the simple moving average.
Operating on a spectrum of 100, these two bands can tell you if a market is in overbought or oversold conditions. And if it has any thrust in its engines – or if it’s losing altitude.
Safe takeoff and landing conditions
It didn’t take long for Sully to realize that he wasn’t going to make it back to LaGuardia – and that nearby Teterboro also wasn’t an option. He was going to park it in the Hudson. The entire episode took less than three minutes.

When evaluating whether the market has enough power to support your trade – you can simply look at Stochastics to determine first if you’re in overbought or oversold conditions. To do this, simply monitor the position of the oscillator relative to its range. If it’s over 80 – then you’re likely in overbought conditions. If it’s under 20 then things are getting pretty cheap and you’re in oversold conditions.
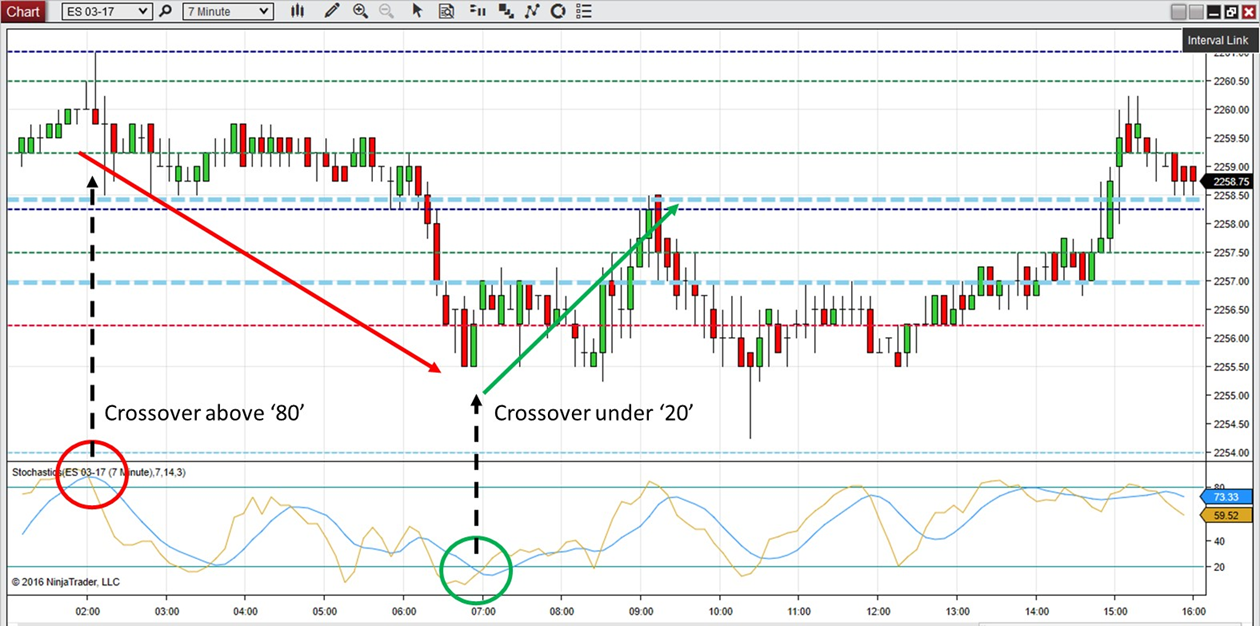
If you are in fact in overbought or oversold conditions – then keep an eye on the two bands themselves. Over 80 and you’re watching for the ‘percent K’ to cross under the ‘percent D’. Under 20 and you want the exact opposite – the ‘K’ needs to overtake the ‘D’ by crossing over.
Looking at our ES example, you can see two reversal conditions – called out by Stochastics.
Avoid second-guessing your conditions with verification
Despite the fact that everyone survived, captain Sullenberger’s judgement and decision-making would come under scrutiny. In the end he prevailed as simulations would validate that the plane would have never made it to either LaGuardia or Teterboro.
His analysis wasn’t just engine thrust, but an overall evaluation of flight conditions, distance and available options. When making a safe takeoff or landing with a trade, the same is true. Stochastics should just be a single part of your overall evaluation process – but not the only part.
When gauging market momentum, complement Stochastics with either RSI or MFI to validate the veracity of the signals that you’re receiving. In instances where you don’t have verification, don’t make a gut decision – simply wait and keep your account alive.
Safely land trades, even in the most daunting of markets
The now famous ‘Miracle on the Hudson’ was commanded by two pilots, Chesley ‘Sully’ Sullenberger (a former fighter pilot) and Jeffrey Skiles. Between the two they had a combined 35,000+ hours of flight time. No doubt that experience and those instincts paid off – but interviews would reveal that it was preparation that helped them pull off that landing.
Don’t fly on instincts and prior experience alone – especially when trading the news. Use Stochastics to determine entry and exit conditions. Depending on your trading style, either watch for crossovers or overbought/oversold conditions. When the oscillator peaks above 80 keep an eye out for a downturn, and below 20 an upturn, for a buy opportunity.
When you see the faster moving ‘K’ line cross over the slower moving ‘D’ line – you could be on an early opportunity to buy – and conversely when it crosses under, you could be in an opportunity to sell.
Either way, read the conditions early and make your move! Land trades safely and confidently amid the hysteria of the market.
