It happened during a late-night power failure stress test. The safety systems were deliberately turned off on The Number Four Light Water Graphite reactor at Chernobyl Nuclear Power Plant.
A design flaw in the reactor, combined with a checklist that was ignored for the safety test, led to uncontrolled conditions that eventually resulted in an open-air graphite fire. The fire burned for 9 days, releasing plumes of radioactive isotopes into the atmosphere which spread to much of western Soviet Union and Europe. The world was caught completely off-guard.
When price is about to blow in your market, you can give yourself advance warning in the form of RSI (Relative Strength Index) and/or MFI (Money Flow Index). They can serve as your gauges for market temperature and indications for potential reversal points.
Critical gauges to watch when monitoring the market’s core
The day before Reactor Number Four exploded, Chernobyl was asked to supply additional power to a nearby grid that unexpectedly went offline. The Kiev electrical grid controller requested that Chernobyl postpone the fateful test so that it could supply power for the peak evening hours.
Every day the markets are tested with volume extremes, fueled by aggressive buyers and sellers. This creates strains on price as conditions either get too hot (overbought) or too cold (oversold).
Thankfully, there are two oscillators that can be used to determine when conditions are approaching these extremes.
Respectively they are:
- Relative Strength Index (RSI): A momentum oscillator that measures the speed and change of price movements.
- Money Flow Index (MFI): An oscillator that uses both price and volume to measure buying and selling pressure.
Keeping an eye on both can reveal critical market conditions required to spot a reversal entry.
Conditions that tell you when the market’s ready to blow
Not shutting down the reactor in advance of the test severely limited the preparation time the engineers required. According to accounts, this meant that the test was left to the night shift, which didn’t have the manpower or experience usually required for a test of this importance. An emergency core cooling system was also shut down — something that definitely comes in handy should an issue arise with the core.
As the market moves along, understanding the severity of pricing conditions is critical. If you want to avoid trading in the chop that is falling for minor price fluctuations that don’t amount to a profitable reversal, you’ll need a fast way to spot real spikes and dips.
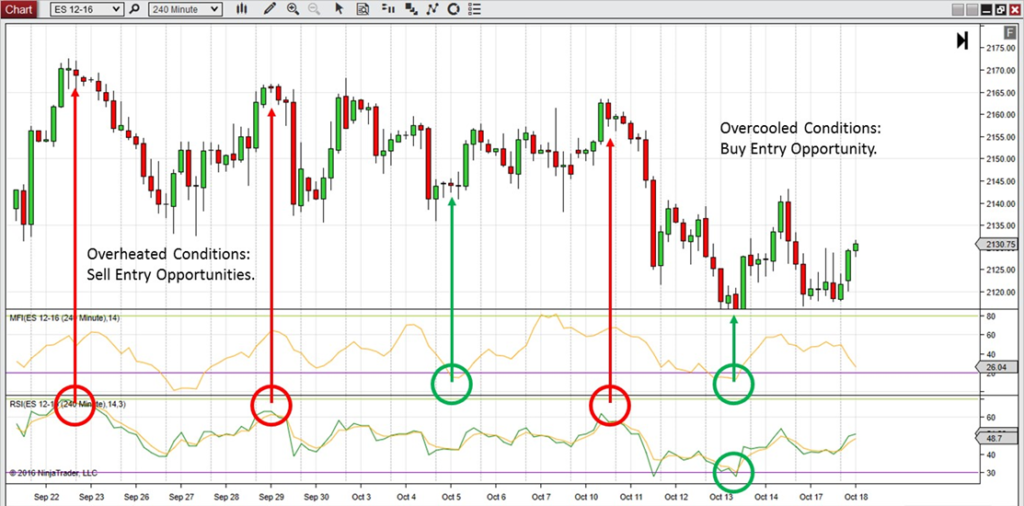
Both the RSI and MFI operate with indexes of zero to 100. Setting them up takes seconds, and in an instant you know if you are in overbought or oversold territory. Anything over 70 on both and you’re heating up — over 80 and you’re about to blow as the market is overbought. Conversely, anything below 30 and you’re getting cold — under 20 and price has frozen over with an oversold market. Knowing this allows you to spot conditions for a reversal entry.
Profiting from the fallout, regardless of the direction
The details of the initial explosion and nuclear chain reaction that followed are both tragic and fascinating. Alexander Yuvchenko was on site for the explosion. Once he stepped outside, he recalled a ‘very beautiful laser-like beam of bluish light… that appeared to flood up to infinity.’ The graphite fire that followed wouldn’t be contained for another eight days.

When looking for reversal entries using the MFI or RSI, you won’t need a bluish light in the sky or a graphite fire to know when the market is overheating. Simply keep an eye on the oscillator(s) and prepare to make your move as it hikes above 70 or dips below 30.
Note the ES example here. When price reached a real extreme, the oscillator pegged out and shortly after a reversal occurred, as price went back to the value zone.
Timing your entry so that you’re not caught in the blast
It took months before the world fully understood the actual fallout from the Chernobyl disaster. It took years to fully assess the damage and casualties caused by the radiation that was released into the atmosphere.
Since the RSI and MFI are real-time oscillators, you can be confident that you’re getting the data you need in the moment — without having to wait months. Closely monitoring the extreme, and especially price behavior — between 70-80 at the top and 30-20 on the bottom — will be critical in timing your entry.
As you would with any reversal entry, keep an eye out for exhaustion bars followed by long tails at the top or the bottom. These are signs that the swing is reaching its peak and that the buyers or sellers are losing steam. Great conditions to make your entry.
Profit while everyone else runs for cover
When it comes to cost and casualties, Chernobyl is the worst power plant disaster in history by a long shot. In fact, it’s one of only two ‘level 7’ events (the maximum) on the International Nuclear Event Scale. Decontamination involved over 500,000 workers and cost an estimated 18 billion rubles.
Don’t be caught off-guard when price is reaching an extreme and about to overheat. Use the RSI and/or the MFI to monitor market conditions. When price clears 70 you’re in overbought territory. Over 80 and it’s getting ready to blow. The same is true below 30, and then below 20, for oversold conditions.
Plot your reversal from a place of safety and profit while everyone else is running for cover.
