It seemed like the perfect heist. Smash, grab and a clean getaway. Less than 90 seconds and they were back out the door with over $5 million in jewelry. Quite a caper by any standard.
Except for one detail – the items taken were fitted with small GPS tracking devices, which were basically invisible to the naked eye. The result? Ten arrests for the suspects who practiced the robbery – Ocean’s Eleven style – before pulling it off.
When price is on the run and taking your hard-earned capital, you can track it down using the Fibonacci suite of tools. They’re free, effective and will help you collar both locations and entries — if you know what to watch for.
Why most traders find it hard to collar good entries
The Koreatown robbery was regarded by law enforcement as being well-planned and coordinated. Apparently the perpetrators came in from out of town and practiced the robbery, before carrying it out.
During every minute of the market’s open, retail traders sit watching their charts, doing their absolute best to plot what price is going to do. As their entries are planned, many fail to take into account the basic laws of averages that play into price’s behavior. Setting news events aside, technical price action trading can be boiled down to a projection of support and resistance levels based on prior performance.
Even with this available intelligence, retail traders often choose to go with their gut – opting for entries that aren’t really based on anything other than eyeballing the market.
Fortunately, there is a suite of tools ready and waiting in your preferred trading platform that help remove much of the guess work.
A free suite of tools that helps you deal with offensive swings
The GPS devices used to track down the suspects were small enough to fit inside the clockworks of a watch without being detected. They sent a signal of the stolen goods’ whereabouts, allowing authorities to track down multiple suspects in different locations throughout the surrounding area.

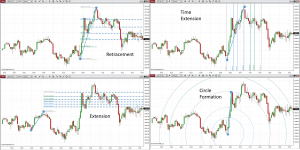
When trying to track down price, you can plant a GPS device of your own in the form of the Fibonacci tools. There are three primary tools used by many professional traders:
- Retracement: Helps you figure out how far price may come back after spiking or dipping to an extreme.
- Extension: Projects breakout levels you should be watching when price is on a continuation towards new highs or lows.
- Time Projection: Allows you to mark future moments in time where price will be influenced after a selected swing.
- Circles: Projects ranges where the ripple effect of a selected swing may impact price when they’re eventually intersected.
With each tool, the Fibonacci ratios are applied – and when price visits these levels you should be on the lookout for price action in the form of reversal or accelerated continuation.
Track down high-probability entries regardless of where price runs
To collar price, especially when it’s on the lam, it helps to have a sense of where it may be headed. For many traders, just a general sense of where and when to keep an eye out for possible action that can be radioed in for a trade is good enough.

The Fibonacci tools have a habit of doing far more than that. They are incredibly accurate, almost right down to within a few ticks of any projected reversal or continuation. With each tool, you’re simply selecting the tips of any offending swing. Once you have that selection made – you can start monitoring those moments and price levels with confidence.
Check our ES example here, using Fibonacci Extension. Simply plotting a swing earlier in the day, you get several levels – all within close (and useful) proximity of each other. It’s no coincidence that price respected these levels with an uncanny level of accuracy.
With each level you would have had multiple entry and exit opportunities to monitor. A great place to be, especially with the ES headed for new highs!
A set of tools worth incorporating, not overlooking
It’s worth noting that the Fibonacci tools are not new, and they’re not forgotten. They’re simply overlooked in exchange for other tools. Keep in mind that these tools are not used for final entry confirmation – rather they are designed to help identify possible locations.
Incorporating the use of these tools into your macro analysis of any market – perhaps at the start of your trading day – will help you plan for multiple price action scenarios. Using them to analyze intra-day swings will help you deal with unexpected developments and still profit.
Don’t overlook the Fibonacci tools – add them to your regimen and complement your trade planning process with a proven suite of tools!
Take down profits in broad daylight before they get away
The Koreatown heist, as the robbery came to be known, happened in broad daylight. At 10:50 am, the suspects overpowered store personnel. The haul from the Rolex watches alone was $800K. The suspects were eventually caught one by one – thanks to the tracking devices – and brought to justice.
You can catch price in broad daylight as well, simply by using the Fibonacci retracement and projection tools. After price takes a turn and proceeds to go on the run, take the extremes – specifically the high and low points to chart your entry. Pay close attention to the bands just beyond 100 and plot your capture.
As price approaches each of the bands, set another oscillator as a way to further triangulate price, namely RSI, MFI or even Bollinger. When it approaches, use these to determine if you’ll be taking your continuation or reversal entry.
Plot your ultimate exit at the next band – always careful to have an intermediate backup target if need be. Stand up for your account and don’t let price outrun the long arm of profits.
