Damn that was fast!
Have you ever tried to watch a tennis ball slammed at 120 mph by a pro player? How can anyone see a ball moving that fast, much less effectively return it? They are able to because they are professionals. If you are not a professional, it is best not to stand in front of them.
The same warning holds true in the futures markets. Institutional money drives the prices in the futures markets fast and hard as well. You think that 120-mph serve would be scary to face? What about the powerful orders served up toward your account by the professional traders in the futures markets every day?
You won’t beat a professional player on the tennis court. And you won’t beat the professional futures traders at their own game either. Therefore, in either case, you can’t afford to be standing in front of these professionals when they play.
Putting Fibonacci retracements to work for you will show you where the professionals are going and help you move with them. Then you will put cash in your pocket and keep your account safe from the 120-mph serves of the professional traders.
What Is A Fibonacci Retracement?
Imagine being the player on the receiving end of a 120-mph serve. Your main thought is to just defend yourself and get the ball back over the net somehow. The least of your concerns is how far over the net it goes.
Prices in the futures markets act the same way. Asset prices get slammed hard in one direction or another. Afterwards, there tends to be a correction.

The key retracement points of a price reversal are shown as percentages of the previous significant move and provide traders with a visual of key potential entry points for new trades as the asset resumes its previous trend.
A Fibonacci retracement is a set of naturally occurring percentages. It predicts the likely price recovery points for an asset in the opposite direction of the previous move.
How Can Small Traders Use Them?
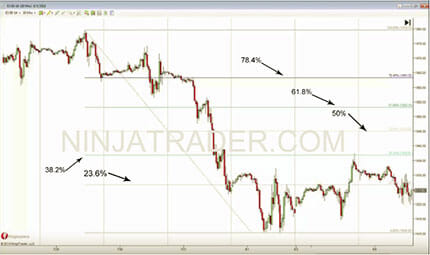
If we view the major price drop shown on the chart as the powerful serve in our tennis match, we can see at the bottom where the actual price volley begins.
It quickly becomes clear that the powerful institutional positions have established the volley between the base and a 23.6% retracement. Once that 23.6% level is breached, the price touches the 38.2% retracement and immediately resumes the previous slide down. All of the touches of typical retracements are excellent trading opportunities.
Using the Fibonacci retracement tool allows traders to watch the price areas highlighted by these key percentages. When these key correction percentages are reached, smart traders begin watching for the resumption of the previous trend.
These price points create excellent opportunities for new positions as the established trend continues.
How Do We Know When To Use Fibonacci Retracements?
With all of the tools out there, how can you possibly know the best time to apply Fibonacci retracements? If you try to use it selectively, it can be difficult to know when the time is right.
The Fibonacci retracements work best when the original move is well defined. The larger the original move, the better the potential gains from trading the retracements will be.
The Fibonacci tool, available in much of the current leading trading software, displays in a very subtle way. It allows traders to keep it open all the time without blocking other information or tools in use.
Having this tool open at all times allows you to see the trading opportunities it identifies as they occur with particular assets of interest.
The Easy Way To Get Immediate Gains From Fibonacci Retracements
Fibonacci retracement is a powerful tool that can keep you on the same side of trades as the power hitters in the futures markets. That is where the money is to be made.
It is easy to read. It doesn’t clutter up your screen with confusing information and it is very effective.
The excitement builds as the asset price approaches a key Fibonacci retracement point. We ready ourselves to pull the trigger on an order. As traders, we all tend to be aggressive in our approach. We want to get in the game!
The risk with the Fibonacci tool is the temptation to enter a trade too early. You always need to be sure that the trend has actually reversed at a particular retracement point prior to opening your trade. There will be times when it blows right through a key point, even when it has reversed at that point previously.
If you are looking for a sign on your trading screen that says: “Enter Here” the Fibonacci retracement tool is about as close as you will come.
