Life or Death by Indicators
Four trading indicator ‘demand-ments’ that you must follow if you want to profit.
It was a perfect day for diving.
Bill and Ann were in great shape. They had both the equipment and experience they needed to enjoy the afternoon.
Yet shortly after the day’s dive started in a local quarry, only 60 feet down – Bill started to have trouble with his weight belt. Ann would go to help, an a tragic twist of fate Ann would be the one declared dead minutes later.
The reason? Drowning.
All this despite having a full air tank and plenty of experience.
What went wrong? Everything. Faulty equipment. Bad judgement. Panicking under pressure. All in a matter of seconds.
Okay, so maybe the stakes aren’t life or death… but if the above tragedy had some striking similarities to a recent trading session in the market… you’re not alone.
Every day, in futures every market, traders dive for profits. Their accounts (tanks) are filled with capital. There indicators are finely tuned and ready. And market conditions appear to be perfect for taking a profit.
Then something goes wrong. And all hell breaks loose.
Like Bill’s faulty weight belt, maybe it’s time to look a closer look at the indicators you’re currently using to determine if you’ve got the right mix.
Or more importantly, if you have any holes or hazards lurking – only to surface when you’re fighting off a loss that could kill your account.
Here are the five vital steps to figuring out if your indicators are helping or sabotaging your account.
They’re not quite commandments… but they’re close. Think of them as ‘demand-ments’ for consistent futures profits.
Profit Demand-ment #1: Know thy truth about indicators.
We won’t relive the tragic final moments of 24 year-old Ann’s life. But suffice it to say, it was a series of cascading events that went from bad to worse.
Even worse? This tragedy isn’t an isolated incident. In fact approximately 100 people die in North America alone while another 100 die diving in the rest of the world.
The lesson for traders is hard to miss if you apply this tragic story to the markets: Danger can lurk in the most unexpected places – especially if you don’t know what to look for.
And the most unexpected place of all? It’s right under your nose.
Those indicators that millions of traders use.
You know the ones. They come standard with every trading platform. There’s a zillion YouTube videos on how they can be used. They seem so standard – that it’s impossible to fathom that they could be wrong.
Here’s the deal: They’re wrong. Like all the time.
Take a fan favorite (and an indicator that’s cemented to every chart I trade) – the Relative Strength Index (RSI).
The premise for this momentum indicator is easy to understand. And the signals that the index offers are incredibly clear:
>> Above 80 and you’re in overbought conditions – look for the sellers to step in.
>> Below 20 and you’re in oversold conditions – look for the buyers to take advantage.
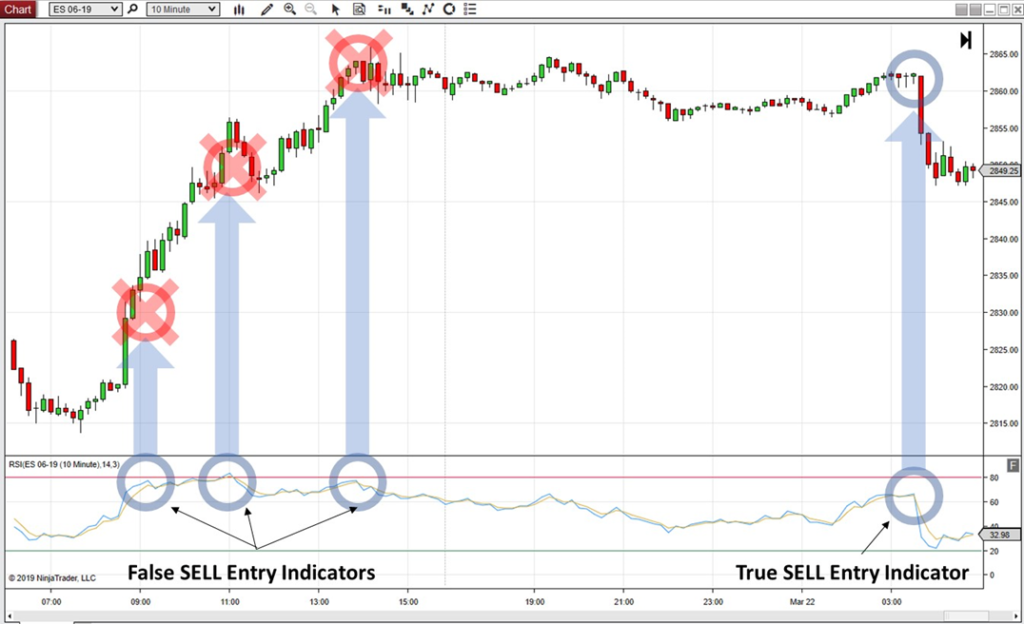
Looking for a clear signal? Our beloved RSI can be wrong as often as it’s right! Knowing exactly how to verify the RSI will keep you from being tricked and trapped in these trades!
Despite its breathtaking simplicity, the RSI is often wrong. And by wrong, we mean dead wrong with no hope of being right for long portions of your session.
Take a look at this recent ES chart, covering an entire day. At market open, the RSI touches 80 indicating an overbought condition. Get ready for a sell entry? Not so fast, ace. Despite this, clear as day signal – the ES kept on trucking up.
Even if the losses from a bad entry indication aren’t bad – you’re still wasting a valuable commodity: Time.
And that is the trap that many trader’s fall for. They see an indication and then go barreling into a trade… only to wait… and wait for it to somehow be right.
Here is the key: Watching just one indicator can lead to trades that lose way, way more than they win.
The key is knowing exactly how to view and organize indicators.
Profit Demand-ment #2: Thou shalt not covet one indicator.
There are at least 17 essential components you should have on your person before taking a dive to any depth below snorkel level. They range from the essential items… like a scuba tank and mask… all the way to a snorkel.
Each item is different, yet essential. Used together they will keep you alive.
The same is true if your technical trading indicators.
First, let’s quickly outline and organize the indicators available to pretty much everyone. We can quickly put them into four basic buckets:
- Volatility: When the natural rhythm of the market is disrupted, a volatility indicator will flag periods where you might experience sharp swings in the market.
- Momentum: If you want to understand the strength of a particular price move, momentum indicators can tell you if there’s enough gas in the tank to make a real move.
- Trend: Want to hop on the speeding train and trade with the prevailing direction of the market? Trend indicators will tell you who exactly is at the wheel, and when they might be losing steam.
- Volume: Nothing happens unless the institutional traders are on board. These are the guys that drive 95% of the market’s volume. Monitoring volume is a vital ingredient in validating what any of the other indicators may be showing.
With this approach, you can quickly organize the sea of indicators out there into easy to digest categories
| Volatility | Momentum Oscillators | Trend & Moving Average | Volume & Money Flow |
|---|---|---|---|
| VIXAverage True RangeChaikin VolatilityVolatility RatioBollinger BandsTrue Range | ADX Elder RayIchimoku CloudNegative VolumeRelative Strength StochasticsTwiggsChandeMACD | Aroon CoppockDonchianIchiokuKSTParabolic SARSimple MovingAverageExponential MovingWeighted MovingHull Moving Average | Volume Rate of Change Volume OscillatorAccumulationChaikin MoneyEase of MovementForex IndexMoney Flow IndexPrice Volume TrendWilliams Accumulation |
Simply seeing this reveals one basic truth:
If you’re looking at only one indicator – you’re going to get burned. Why? Because you’ll have multiple blind spots when it comes to seeing the other forces driving a market.
This doesn’t mean that you should load your chart up with indicators either.
Why? Welcome to the third Profit Demand-ment.
Profit Demand-ment #3: Honor thy indicator categories.
Another way to put this? Just keep it simple.
You need more than one indicator to accurately monitor market conditions. But you don’t need 10. In fact, it’s unlikely that you really need more than three – unless you are doing a chart study of some kind.
If your chart is loaded with indicators, you are likely doubling up on the same information. For example, why would you have both MACD and RSI on the same chart?
This is a highly touted combination – but in reality, it’s like having two speedometers in your car.
Check out our same ES example. Setting the aside the fact that the RSI wasn’t having it’s best day for spotting trades – if you would have layered in MACD – you wouldn’t have been any better off.
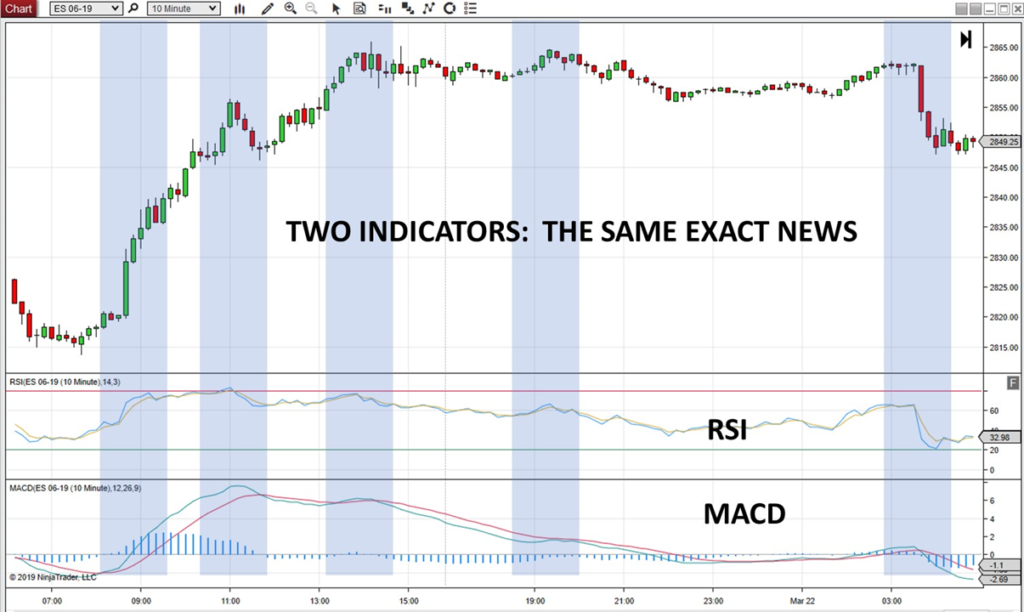
Each indicator essentially mirrors the other. And when it comes to finding possible moments where buyers and/or sellers might be stepping in to create a reversal… they’re both off.
This is why honoring the indicator categories is essential. Loading on up indicators that have the same purpose and focus not only limits the tradable information you have – it leads you into deathtrap trades.
Why? Once you have information that fits your bias or trading tendencies, there’s very little to stop you from going in. Even if it’s to your detriment.
To supplement the categories offered in Demand-ment number 3, here is a quick rundown on the major indicators available in just about every trading platform.
| Indicator | What it does… | How to use it… |
|---|---|---|
| ATR: Average True Range | Tells you the volatility ofprice by measuring the size and activity of priorcandles. | Gauge and set profittargets and stop loss levels based on prior volatility |
| Moving Averages | Demonstrates the strength of trend and possible reversals of trend by comparing different moving averageperiods. | Compare to historicalsupport and resistancelevels while looking forcrossovers as anindication of changes – orcontinuations in trends. |
| MACD | Provides confirmation ofthe momentum behind atrend. A higher MACD isusually tied to an upwardmoving trend, while a lower MACD is an indication ofa down trend | Crossovers with MACD can be a signal that a trend islosing momentum and that a reversal may be coming |
| Bollinger Bands | Excellent for monitoringmomentum and volatility. Volatility usually increases as the bands widen. | When the bands create a tight reliable channel,reversals can be targeted when the outer band is breached. |
| RSI(Relative StrengthIndicator) | Uses prior candles andvolume to determinebearish or bullishmomentum. Also signals overheated marketconditions specific tooverselling or overbuying | Watch for breaches above 80 and below 20 forpossible price reversals. Always watch inconjunction with volume. |
| Stochastic | Shows the speed of pricefluctuation by monitoringmomentum. Great formonitoring the momentumof a trend | When the Stochastic starts to narrow, a trend may betapering off. Likewise,when it widens, the trendmay be gaining steam. |
| Chaikin Money Flow | Using a starting point ofzero – anything above zero could be a sign of strength. Anything below could be a sign of weakness | Can be used as a way to confirm breakouts in either direction if price makes a move – the Chaikin MoneyFlow can verify simply bylooking to see if it’sabove or below zero. |
Now that we know what the categories are. We simply have to land on a combination of indicators that will actually help our trading.
The fourth Demand-ment shows us the way.
Profit Demand-ment #4: Combine thy indicators for profits.
We won’t choose the indicators for you, but we will give you a rule to follow when choosing which indicators to add to your chart.
Select indicators that complement each other, but do not use the same data. Since no one indicator is suited to all market conditions you want indicators that when consistent will actually confirm an entry or exit.
For example, if you have three momentum indicators that are based on closing price – they’ll all look the same – similar to our earlier example. If you add indicators based on volume and trading range/trend – the data will be different. When they synch up you’ll have a confirmation condition you can work with for an entry.
A simple approach any trader can use: Pick one trend indicator and one momentum indicator.
This will give you a great comparison point with which to make both continuation and reversal trades.
Here are a few examples of the RSI paired with a basic Moving Average. In this case our Moving Average periods are set to 50, 100 and 200.
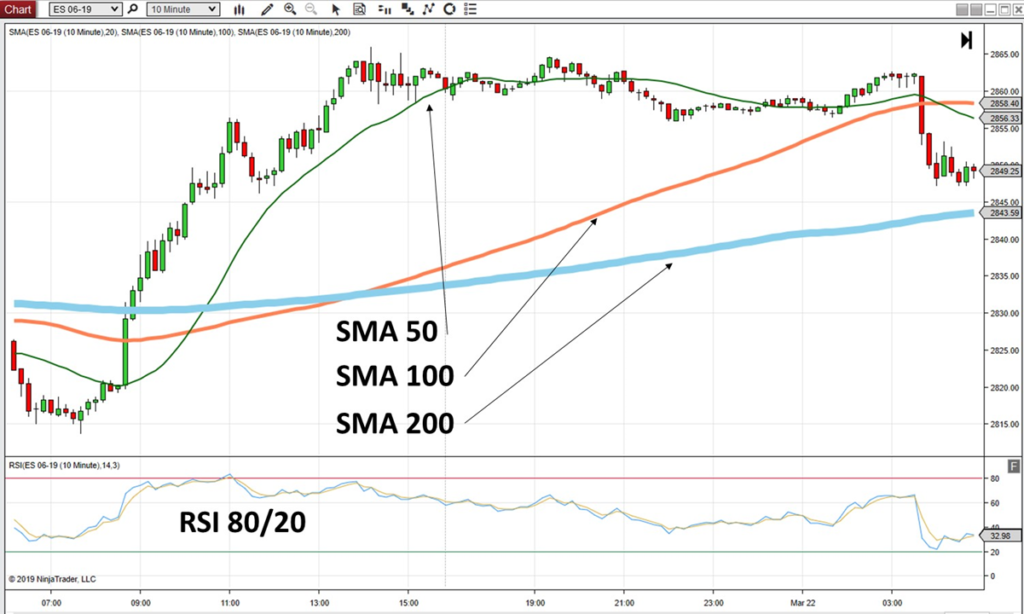
Using our ES example again, one clear condition stands out:
Since we’re looking for cross-overs in with the SMA specifically anytime the 50 crosses over BOTH the 100 and 200 moving periods – we see that the false RSI sell signals would have been avoided. Here’s why: Although the RSI was pegged above 80, indicating an overbought condition – the 50 SMA (green line) was crossing above the 100 and 200 periods. This indicated a bullesh up trend. The second time the RSI breached 80 the green 50 SMA gap had widened – showing no sign of crossing back over below. If nothing else, you would have waited.
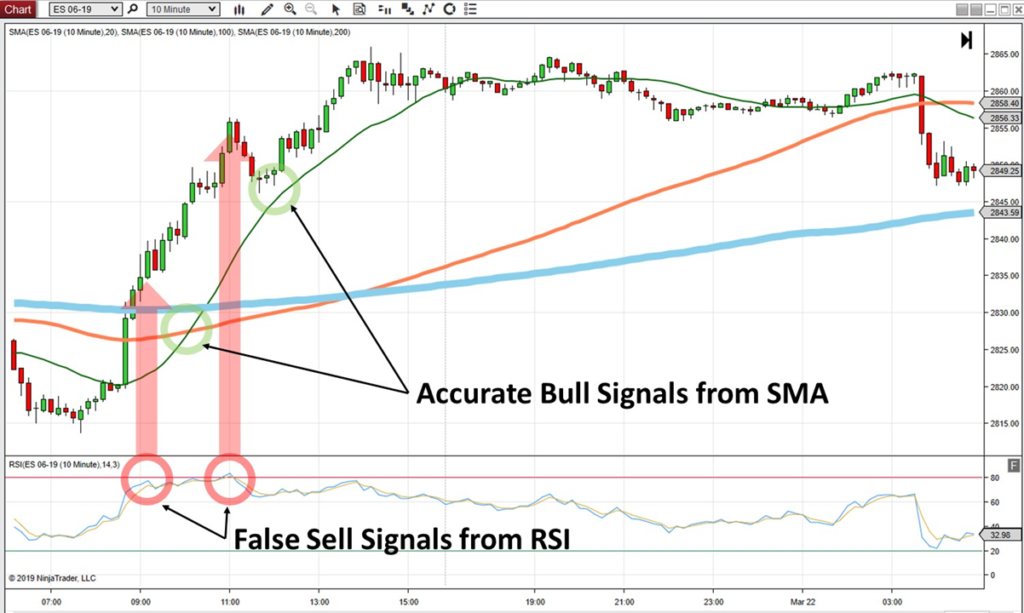
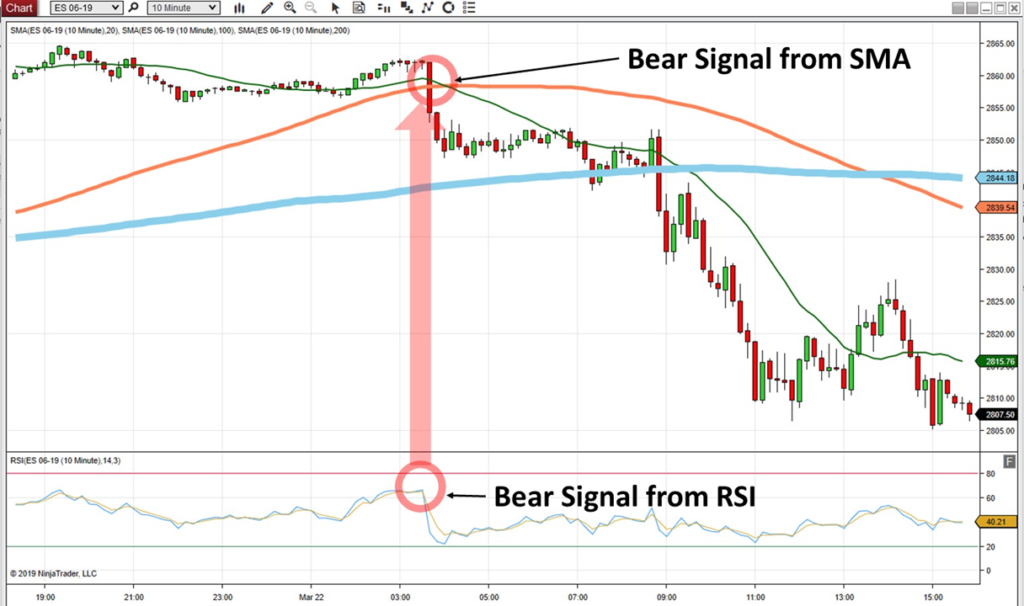
You’ll recall that late in the same session, the RSI did accurately call out a bearish sell signal. Simply having the SMA added to the chart would have confirmed that sell signal.
Here’s why: As the RSI is heading towards it’s most extreme overbought condition, it makes a sharp move down. And this happens just as the 50 period (green line) crosses under the 100. Leading up to this crossover, the prior gap had started to close – as sign that the trend was losing momentum. Crossover at the 50 in combination with the sharp move in the RSI would have been good for several ticks of profit.
As price came thundering down the mountain, you can almost hear the ES God’s proclaim with thunder and lightning… ‘HONOR THY COMBINATION and YE SHALL PROFIT!!!’
Additional indicator combinations to consider include.
| Moving Average + Stochastic | Very popular for forex and Indices trading – combines short and long-term signals for great long-term positions. |
|---|---|
| Bollinger Bands + Stochastic | Overbought conditions and breaches in the outer Bollinger bands create great reversal opportunities. |
| MACD + Bollinger Bands | Another popular version of this strategy is to combine RSI with Bollinger Bands. Both will deliver a similar analysis and great reversal and/or trend opportunities |
As you’re picking, choosing and testing, keep in mind the following:
- Trading Plan: No indicator can replace an actual trading strategy. They can only support. If you’re looking for an indicator to tell you what your profit or risk targets are – you should stop… back away from the computer… and figure that out first.
- Clear as Mud: If you can’t enter or exit with confidence, then you have the wrong combination. Don’t try to force a combination that won’t work for you – or worse yet cause additional stress or confusion.
- Practice Practice: Clarity and confidence comes through practice. If the guy on YouTube made it seem easy and you want to give it a try… great! Just be sure to do it in a demo or sim account first.
- Risk & Losses: If you don’t have a plan for losses built into your overall trading plan, indicators won’t help you. Every trader must have a plan for managing the inevitable losses that will eventually surface with even the best of plans.
Regardless of your ultimate indicator selection, never forget to honor the demand-ments of profiting with indicators.
- Accept that indicators are wrong.
- Never rely on just one indicator.
- Fully understand how each indicator is used and what category it falls under (momentum, trend, volatility, etc.)
- Combine indicators for a more accurate view of your market.
Now go forth and profit.
